Showing posts with label Variation. Show all posts

Friday, December 19, 2008

The Root and the Fix

Our country has many issues right now. There are numerous opportunities for improvement and the debate rages on concerning the actions to get us out of the soup. Whether or not you look forward to the Obama administration, let's take a step back and be realistic. Can the government fix these issues? They can implement short term fixes but the long term solutions must come from addressing the root cause of the problems.

Look at the picture above. Take any issue that the government tries to fix (crime, drugs, economy, etc.) and break it down to the core. The lowest level involves you and me-what occurs within our hearts and minds and the breadth of differences between us.

Is it too far fetched to imagine a United States where improvement comes from the bottom up and not the top down? With the power of our vote, we can build more accountability at the top. With our written and spoken words, we can give constructive feedback to our decision makers. If each of us lived purposed lives, we would systematically start to improve communities, then counties, then states, and finally the country as a whole.

Yes, it sounds a bit hoky but it will never have a chance if we don't even talk about it.

If you notice the picture above, I break towns down by churches. I see ministers having an incredible role as we move forward in 2009. Many people are suffering right now. Folks have lost jobs and homes. Many people are at low points. What a wonderful time for people to know that a better world awaits. People need to hear that this all shall pass. Even in the midst of profound negativity, opportunities surround us.

We need strong messengers right now to spread these encouraging words.


Wednesday, August 13, 2008

The Price of Gasoline


It always fascinates me when an issue becomes hot and dominates the news. Why did it suddenly become so news worthy? Did we experience a drastic change that led to the issue or was the cause more gradual and not noticeable until a tipping point was reached?

The price of gasoline is a great example. Any “stupid” person knows the economy drives election outcomes and our pump pain could influence the casting of ballots in November (if the current trend continues). Yes, the pain is real and I wince every time I fill up my gas guzzling vehicle. But how did we get to this point? It may just be me but high gasoline prices were seemingly not on the radar until recently. Did the prices suddenly spike high or has the change been more gradual over time? Let’s let the data tell the tale.

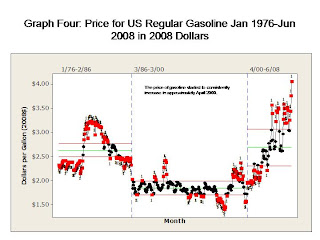
Graph One shows the United States city average for regular gasoline by month from January 1976 to June 2008. Based on the data, the price increases over time but we would reasonably expect that due to the difference in costs of living during the time frame. Graph Two shows the same prices but uses the consumer price index (1982-1984=100) to express the prices in 2008 dollars. Based on this data, we felt approximately the same pump pain in the late seventies to early eighties.

Graph Three trends the month to month change in the price of gasoline. The differences were fairly consistent from January 1976 to approximately February 2000. The magnitude of change increased in approximately March 2000 and again in approximately September 2005. Stated another way, the month to month variation in prices seemed to increase in March 2000 and September 2005. What we feel now appears to stem from September 2005.

Graph Four breaks the overall price trend into stages. Based on the data, the price of gasoline started to consistently increase in approximately April 2000.

My overall conclusion: The opportunity for improvement we face now is the result of a gradual change that began in 2000. I don’t know what changed. But the factors and forces that led to what we face today seem to have been in play for some time. Did we see them? Did anyone take notice of the trend? Could something have been done earlier?

Thursday, January 17, 2008

Understanding Political Polls


The two tables above summarize three recent polls conducted in South Carolina. (CLICK ON THE TABLE TO MAKE IT LARGER)

The top table shows a "point estimate" of the percentage of South Carolina voters planning to vote for each candidate. Is this the true percentage? Maybe but probably not. The truth may be less than or greater than the point estimate.

To get a better estimate of the true percentage, the poll includes a margin of error. By applying the margin of error to the point estimate, we strengthen the estimate by adding a lower and upper bound to the truth. The second table applies each poll's margin of error to each candidate's point estimate. For example, in the Clemson poll, the estimated percentage of voters planning to cast a ballot for John McCain was 29%. Applying the margin of error (4.6%), we can now say the estimated percentage of voters planning to cast a ballot for John McCain is at least 24.4% and at most 33.6%.
Don't just compare the point estimates of two candidates. Instead, compare the upper and lower bounds. If the ranges (of two candidates) do not overlap, there is statistically significant separation between the two candidates.

The margin of error is based on two main factors: Sample size and confidence level. Obviously, the larger the sample size, the better the estimate. A larger sample size will decrease the margin of error. The confidence level is a measure of strength for the estimate. Most results of political polls are stated with 95% confidence. This means there is a 95% probability that the upper and lower boundaries contain the true percentage. There is a 5% probability that the true percentage lies outside the range.
I hope this helps.


Friday, December 14, 2007

The All Powerful Bell Curve


What do you think when I mention bell curve? Is it just another business concept to you or does it have deeper meaning? At the risk of sounding weird, I'll say that it has deeper meaning for me.

In the working world, the shape of the curve is a graphical representation of a business process' behavior. Why can't it also serve as a model for our lives? Please, indulge me.

The bell curve is symmetrical about a middle point. There is equal weight on the right and left. If you measure a large quantity of a process’ output and a histogram of the data is bell shaped, the expectation, over time, is the process will be balanced at this middle point. This point can be compared to a target value to learn if the process is running on or off target.

For life, we need this point of balance. Without it, we drift too far right or left. These drifts can be disastrous or hazardous to health. They may affect or destroy families. God’s first commandment is “You shall have no other gods before Me”. These "other gods" are anything we put before God: money, work, etc.. If we break this commandment (or others), we lack a balance point. We let a source pull us and soon our priorities are not in the correct order.

Monday, November 26, 2007

Small Groups Updated


I received a great comment from my earlier post which led to the revision (above) of what the objectives should be for the small groups:

1. Make the variation approximately the same for all groups. If you are familiar with analysis of variance, this is one of the assumptions that must pass.
2. Minimize the variation within each group. Ideally, we want each group to have the same target, each group to be on target, and for each member of the group to be as close to the target as possible.


Small Groups


I love it when the world presents examples (to me) of the tools I teach and coach. When I see a concept alive in a non 9-5 environment, it confirms to me why I do what I do.
For example:
The tool: Variation exists everywhere. If you want your business to improve and your customers increasingly satisfied, at some point, you will need to implement a variation reduction process. There are many in the world today including Kaizen and Six Sigma.
The non 9-5 environment: In joining a church, it is probably safe to assume that each member has the same "target". The top graph above depicts the whole congregation as sharing the same target (red line) but differing in commitment to the target.(variation)
If the church wants to improve, it must reduce this variation around the "target". In that spirit, many churches (including mine of 3000 members) are implementing small groups. The concept is that the whole is only as good as the sum of the parts. The groups are natural divisions of the congregation: men, women, teens, senior citizens, etc. The second graph depicts breaking the entire variation down by the groups. Some groups are more homogeneous than others or some groups have less variation than others.
By meeting regularly, the hope is that, over time, the groups become similarly homogeneous (depicted in the third graph) with approximately the same variation in commitment to the "target". When this occurs, the church as a whole improves.

Thursday, November 15, 2007

Changes in Process and Life

You keep a mean and range control chart (see above) to monitor a key process. Every two hours, you collect three consecutive pieces of the output, measure a dimension or characteristic on each piece, record the measurements on the chart, calculate the mean and range, and plot the mean and range. The last twenty five subgroups' means ran higher than the historical level but the range stayed consistent. Meaning, the process variation did not change but the location of the process moved to a different place. What do you do? Well, there are two choices:

If the cause of the relocation is due to a special cause or abnormal circumstance, find the special cause, eliminate it, and the process will return to "normal". But what if there is no special cause? Do you adjust the process to bring it back to normal or do you accept the process' new location and adjust accordingly?

This happens to us in life-We float along having good and bad days. We accept where we are and don't do much to disrupt the daily routine. But what if things change and we find ourselves in a different place or different cicumstance? Well, again, we have two choices:

We fight real hard to get back to where we were. This new place is not comfortable and disrupts our equilibrium. We chalk this up to a special cause and wait to resume life as we knew it. Or, we make the best of this new circumstance. We are here for a reason. Instead of working to get past the special cause, we stop and think why this happened and pay attention to what it might mean in our lives. This might be a new opportunity for us and our family and we might just have to "Do" and trust that the outcome will be positive.
The journey we travel in life is not always a straight line. There will be many fluctuations and side paths along the way to teach us lessons and for us to practice our faith.


Saturday, July 07, 2007

A Tough Lesson in Process Capability


Have you been following the recent stories about "defective" products from China? It seems that a new defect is found each week on something imported from the rising economic giant. The cases included toothpaste, pet food, and seafood tainted with hazardous chemicals, lead paint on toy trains, and defective tires. In some cases, the consequences have been fatal.
The recent trend has been for companies to locate to China to take advantage of the low labor costs and market potential. There is no ignoring that labor costs are less but what we are starting to see, in my opinion, is the total cost of doing business with China.
The Food and Drug Administration samples (I am researching the sampling plan but at this point I am assuming they don't 100% inspect all shipments) imports into the United States. The graphs above are a summary of their findings from June 2006 through March 2007.
The first graph above (click on each graph to enlarge) shows the top exporting countries to the United States. Note that China is the second largest exporter. The second graph shows the mean number of "refused shipments" by exporting country June 2006 to March 2007. If the FDA finds a defect in its inspection, the shipment is refused and held for the exporting country's disposition. Note the top three are India, China, and Mexico. These are the shipments that were rejected in the sampling plan. What about the shipments that were not inspected at all? Well, in the case of China, we know they contain defects.
To be objectively fair, the third graph converts the refusals into a rate (number of refusals per $100,000,000 imported). This statistic clearly shows India as the "worst" exporter to the United States. I have not read many stories about Indian products. Have you?
I'll make this analogous to what most of you do every day: Your customer gives you a specification for the product or service you contracted to produce. As the supplier, it is your job to determine (in advance) if your process can capably produce to the specification on time, with good quality, and at a competitive price. If your process is not capable, you have three choices:
1. Ask your customer to change his specification to meet your process
2. Change your process
3. 100% inspect the output of your process
Number one rarely happens. Numbers three and two are costly.
The data above suggests that China's economic system is not capable of supplying defect free product to the American public. So, China has three choices to make. Throw number one away. The American public will not loosen its expectations for toothpaste, food, and tires. Clearly number two must happen and can't happen fast enough. In the interim, number three should happen because we (America and the world) purchased from China without knowing China's capability. Now we depend on China' imports to keep our economy moving. We can't simply desource them.

Sunday, April 15, 2007

When Incapable Processes Hit Close to Home


Some of you are familiar with the term process capability. Simply defined, process capability is the ability of a process to consistently and reliably meet the requirements of a customer. The process is what you do to deliver a service or product to your customers.

Before an honest customer/supplier relationship can begin, the latter must provide objective evidence (to the customer) of acceptable process capability. If no such evidence exists, the customer will demand extra measures to guarantee the capability. These extra measures are costly to the supplier.

A recent, large news story involved the death of multiple pets (in the United States) after eating "bad" pet food. After investigation, the food was found to contain tainted gluten from China. The gluten contained melamine, a chemical used in plastics, fertilizers, and flame retardants.

As the story continues to unfold, it appears that the root cause of the deaths lies within the process of producing and exporting foods from China. In Saturday's paper, an article titled Pet Food Woes Highlight China Food-Safety Issue, described, in essence, an extremely incapable process for bringing high quality and safe foods into the United States from China. The first paragraph says it all: "The list of Chinese food exports rejected at American ports reads like a chef's nightmare: pesticide-laden pea pods, drug-laced catfish, filthy plums, and crawfish contaminated with salmonella."

As I understood the article, the process for exporting from China is depicted in the simple diagram that appears above. The article mentions that in 2007, about 200 Chinese shipments per month have been rejected at United States ports by the Food and Drug Administration. Does this sound like a capable process to you? Overlay this to your work. Do your customers allow 200 mistakes each month? I doubt it.

What jumped at me was the reliance on inspection. Not 100% inspection but sampling. We know the process is not capable. Put another way, we know it is sending defective food to us. When it arrives at our ports, we inspect a fraction of the total. If the inspection passes, the shipment is released. If the inspection fails, the shipment is held. So, what does a passed inspection mean? The shipment is safe and of high quality? ....Probably not. To me, it only means the inspection passed. The bigger picture is that China's processes for farming, etc. are not capable of consistently exporting safe food to the United States. We should be 100% inspecting all shipments and demand that China improve its processes. Wow! Easier said than done, right?

See the pareto diagram at the top of the page. The graph summarizes by exporting country, the number of shipments rejected by the Food and Drug Adminstration's inspections in 2007. This helps give perspective on the world's rush to move production to "low cost" countries. The top two countries on the graph are India and China. This pair is arguably the top countries being courted by the global, business world. Does the adage, "you get what you pay for" come to mind? Note: What I don't show in the graph is the total number of shipments rejected versus the total number of shipments received. It is safe to assume that China and India ship more to the United States than most other countries. So, to be completely fair, the number of rejected shipments should be expressed as a percentage of total shipments received. I tried hard to get the total shipment data but could not find it.

Saturday, February 03, 2007

Quincunx Board

One of the golden rules of quality engineering is understanding the difference between common cause and special cause variation. I love to talk about it. Doing so adds a bit of pitch to my voice. But I'll admit it took me some time to truly understand the concept. I had heard it from others and agreed with the principle but it wasn't until I saw a quincunx board experiment that the light bulb went off in my head.

The board has been around for a long time. It was invented by a mathematician named Gallo in the 1800's. Pictured above, it works by dropping a series of balls through rows of precisely located pins. Each ball, as it hits a pin, has a 50/50 chance of falling to the left or right. When the balls pass through all rows of pins, they fall into a slot or cell. The shape of the ball's distribution forms what looks like a bell shaped curve. This 50/50 behavior represents common cause variation. The pins can be adjusted to show the effects of special cause variation.

The value of this "factory in a box" (as it is often called) is being able to quickly simulate processes or tests that would be impractical to perform in real life. Included in the simulations are statistical inference, process centering, random inspection, control charts, pre-control, and process management. In the simulations, concepts become visual as the output matches the math.

Quality Minds, Inc. uses a quincunx board in its services. We would love to demonstrate the power of this device to you.

Here is a link to an applet that depicts the quincunx board in action:
http://www.jcu.edu/math/isep/Quincunx/Quincunx.html

Tuesday, October 17, 2006

The Difference Between Customer Limits and Process Limits

If you polled a large number of quality gurus around the world and asked them to list the top ten concepts that a quality professional must understand, at or near the top of the list would be the difference between customer limits and process limits.

Tell me if this makes sense to you: A process can be in perfect statistical control but be completely incapable of meeting the requirements of its customers. If you understand this statement, you can stop and browse the web. Just make sure you are helping others to gain this knowledge.

A process will run the way it is set up to run. It has inferent, "common cause" variation that governs its behavior every working day of the year. Every now and then, "special causes" occur that interrupt the normal behavior of the process. These "out of control" conditions must be discovered and eliminated. Once special causes (or as many as can be eliminated) are eliminated, the process is said to be in statistical control and governed by random behavior.

Process limits set the boundary between common cause and special cause variation. These limits can't be arbitrarily set but must come from the process' historical behavior. If you set the limits any other way, you are holding the process to a standard that it was not set up to meet. It is analogous to demanding zero defects from a supplier when you refused to pay them up front for preventive techniques designed to garuantee zero defects. You can ask for zero but the supplier was not set up that way on the purchase order.

Notice I have not mentioned a tolerance or specification yet. Before you can start talking about a process' ability to meet a customer's requirement, you need to know that the process is in control and stable. If it is out of control or constantly moving, how can you truly say that a customer's requirement can be met?

Once the process limits are calculated and taken to be sacred, you now overlay what the customer wants onto the process limits. If the customer's limits are wider than the process limits, this suggests that the process is capable of meeting customer requirements. If the customer's limits are tighter than the process limits, you are in for a mess. This means the process will not be able to consistently meet the customer's requirements.

Golden rule #1 of Quality Engineering: Don't confuse customer limits with process limits. Don't use customer limits to calculate process limits. Let the process speak for itself.

Monday, May 22, 2006

Teenagers and Control Charts

I have discovered the perfect case study for teaching the concept of variation-Teenagers!

First, the concept of variation: There are two types of variation in a process, common cause and special cause. The former is the ebb and flow of the process. This is what you set it up to do every minute of every day. The variation is random and due to chance. The common cause variation defines the process' capability to meet customer requirements.

If something abnormal occurs, common cause variation is interuppted by special cause variation. Often called assignable cause variation, its occurence is due to a signficant event. One that should be relatively easy to discover if proper resources are applied to the effort.

If no special cause variation exists, the process is in statistical control. It is behaving randomly above and below a central value (called the process mean).

Now to teenagers: A teenagers life is a series of highs and lows. There is a normal pattern of behavior which is analogous to common cause variation. We know our children and their tendencies for behavior. How many times have you reminded yourself of your child's goodness or kindness of heart? You do this because of their common cause pattern of behavior.

Once they reach seventh grade, the special causes kick in. One day they are happy and the next day overflows with drama. There typically is one or several events (we'll call these assignable causes) that instigate the emotional outburts. The keys are recognizing that such triggers exist and being patient enough with your child until the special cause is evident.

As a parent, you often must "pick battles" with your children. You can't argue with them on every issue but some situations warrant a parental outburst.

If you respect the concept of common/special cause, I submit to you that this thought process will help you be a better parent.


Sunday, May 21, 2006

The Ultimate Responsibility of Your Product or Service

A few years ago, three Citadel cadets died in a car crash on Interstate 95 in Dorchester County. In yesterday's paper, I learned that the victim's families filed a lawsuit against the tiremaker claiming that defective tires led to the crash. The defects were allegedly created in the manufacturing process.

I felt unease to use this incident to illustrate a point. But, as is often said, everything happens for a reason. If a lesson can be learned from this horrible incident, then future tragedies may be prevented.

A process is simply inputs being converted into outputs. In manufacturing, engineers own processes. They must understand the needs of the customer and translate the needs into specifications and requirements for production. They then create the mechanism for creating the product or service. People carry out the process every day but engineers create the process.

Capable and stable processes create good products or services. Incapable and unstable processes create bad products or services.

Part of developing a process is to anticipate what can go wrong in the use of the product or service. This is the PFMEA approach that I have talked about in other posts. By anticipating what can go wrong, preventive measures can be taken to avoid actual occurrence. Sure, this is easier said than done but this activity can not be skipped or partially performed.

I tell my football playing son that he can't take a play off. He can't relax. The one play he rests on could cost his team the game. So goes the nature of quality. Quality can't take a day, hour, or minute off. Most manufacturing plants run 24/7 so every minute counts.

Saturday, March 11, 2006

Take Statistics


No! Don't switch to another website after reading the title. I have a great point to make in this post. Yes, we all need a bit of statistical knowledge in our lives. Read on and I'll explain why.

In the March 4th edition of the Post and Courier, there was an editorial by David Brooks of the the New York Times titled "Path to a great education regardless of college you attend". The point of the article was you don't have to attend Harvard (or college at all) to obtain a great education. His recipe for a life-long education includes eight essential ingredients. For example, number four is "learn a foreign language". Do this and you will be more well-rounded and prepared for the flatness of the world.

Number seven is what caught my eye. I read it, did a double take, and read it again. I asked my wife to confirm what I thought I was seeing in black ink. "Take statistics" was offered by Brooks as the next to last piece of advice. Specifically, he said, "Sorry, but you'll find later in life that it's handy to know what a standard deviation is."

Well, where do I start? First, I agree with him. It is fascinating that a popular journalist thought to write this in such a complex article. But what does he mean?

I hope to get multiple comments on this one. I know there are others that believe this and hold to this truth as they conduct their lives and careers.

Here is my take: Simply put, standard deviation is a measure of variation. Life (including business) is, among many things, about change. Change is constant. It surrounds us every day at home, work, church, etc. Your son brings home a bad grade that radically differs from his historical performance. Did he not prepare for the test or did the teacher do a poor job of preparing the students? A new Sunday school superintendent starts at your church and quickly begins to change the culture. Some are happy and others are irate. At work, you perform an end of line inspection of product and find a defective. Your supervisor tells you to stop the next shipment and put everything on hold. You know that this is just an audit and the historical data suggested a high probability of failure.

Understanding standard deviation is the beginning of a journey to understand variation. How processes and systems change over time. The difference between special cause and common cause variation. It is a life-long pursuit that fuels your life and it gives you a unique perspective of the world.

It makes you a better parent, sibling, spouse, and citizen. There, that's it.

Saturday, November 12, 2005

Process Capability and System Capability


If you have worked with suppliers, you know how frustrating it is to be responsible for one that can't prevent defectives from reaching your back door. You throw all your experience at them. You encourage and insult them. Anything to make them better.

Zoom out and think about what is happening. First, an analogy. When you are releasing a new process, you conduct a process capability study. This entails collecting and measuring output (ex. a critical dimension) from the process over a period of time. The results are summarized and compared to the customer's requirements (ex. specification limits). If the output doesn't meet the customer's requirements, you have four choices:
1. Change the customer's requirements so that the process output fits
2. Improve the process to meet the customer's requirements
3. Change the process to make the output fit the customer's requirements
4. Keep the process intact and 100% inspect the output to the customer's requirements.

The first one is typically impossible. Number two should be tried but, depending on the degree of incapability, may yield marginal results. Number three is difficult and costly. Unfortunately, number three is often implemented to much consternation.

Now, think about that supplier that delivers defectives to you month after month. His quality system is not capable of preventing defectives from reaching your warehouse. You have four choices as a supplier development professional:
1. Change your expectations to fit the supplier's performance
2. Improve the supplier's quality system to meet your requirements
3. Change suppliers
4. Keep the supplier and make sure his output is 100% inspected (or more) prior to you.

Number one should not be listed. It should not be considered under any circumstances. Number two should be tried but will take much time. This is what supplier development really means. Number three is the last straw. It is difficult and costly. Number four is not done enough but must be a focus to protect the customer.

Saturday, August 27, 2005

The Value of Audits


I am a big fan of Dr. Deming. His teachings and advise to world management will stand the test of time. They have so far.

You can go to the website of the Deming Institute and sign up for their newsletter. It won't change your life but will give you tidbits of information to use or think about.

In the recent newsletter, there was a quote from Deming: "How much of our enery is spent trying to fix the people who work in the system, when the trouble comes from causes built into the system by the policies and actions of management?" He is talking about the 80/20 rule. Most opportunities for improvement fall within the responsbilities of management. He's also talking about common cause variation. A production system is no different than a machine. The machine is set up to make a product. A process is installed to surround the machine. This process will exhibit a long term capability that may or may not meet customer's requirements. This capability is the process' common cause variation. What is has been set up to do.

A system is set up by management. They allocate the resources. They commission the writing of procedures and instructions.

This is why auditing is such an important tool, especially process and system audits. A machine's output can quickly be measured with a gage. But how do you know if processes and systems are capable? Auditing.

Before you blame a person, make sure processes and/or systems are functioning correctly. Put another way, make sure you have an audit process that it is giving valuable feedback for the continuous improvement of your processes and systems.